
Part One: Graphing Calculator Exploration of xy=ax+by+c
By: Mary Wisniewsky
We are going to explore various graphs of the equation xy=ax+by+c.
This is a rational equation and therefore will most likely contain asymptotes.
1.) First lets take a look at the graph when a and b are fixed and c is varied.
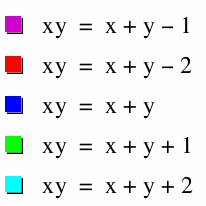
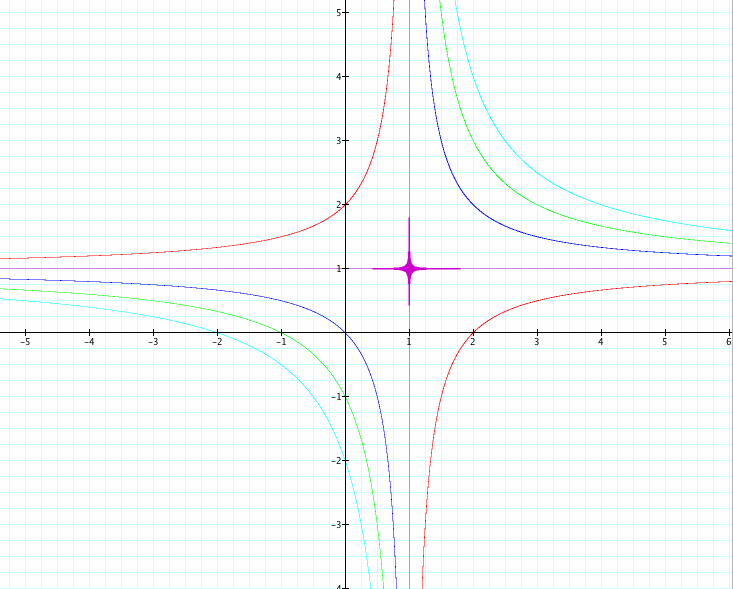
When c is the only coefficient being varied, all the graphs for each equation contain the asymptotes of y=1 and x=1 (except for when c=-1 but we will take a look at this).
Why are x=1 and y=1 asymptotes for these equations?
Well when c=-2,
xy=x+y-2
(1)(1)=1+1-2
1=0 is not a true statement.
In order for the equation to intersect these two lines, the right side of the equation needs to also equal xy=(1)(1)=1.
Thus, when c=-1 we have for the right hand side of the equation:
x+y-1=1+1-1=2-1=1.
This is why x=1 and y=1 is not an asymptote for this case.
What will our asymptotes be for other cases?
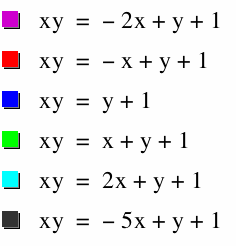
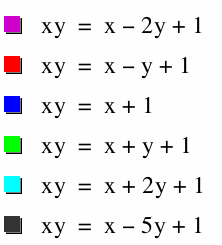
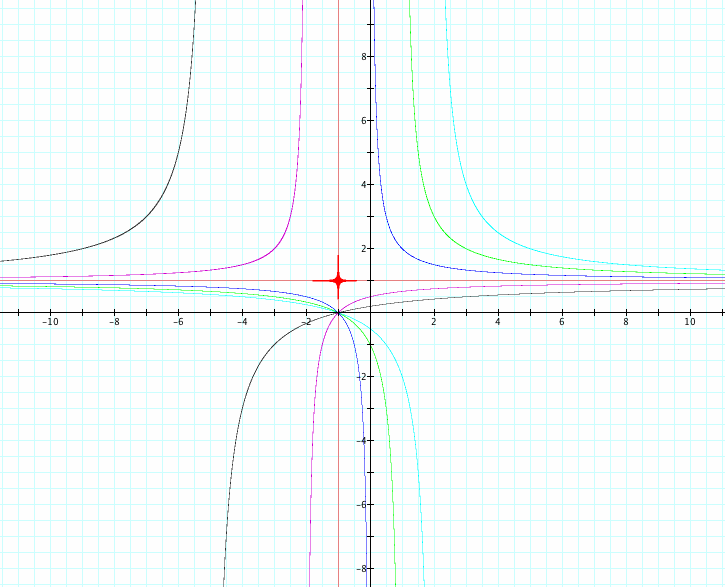
2.) Let's observe the graph of the equation when b and c are fixed and a is varied
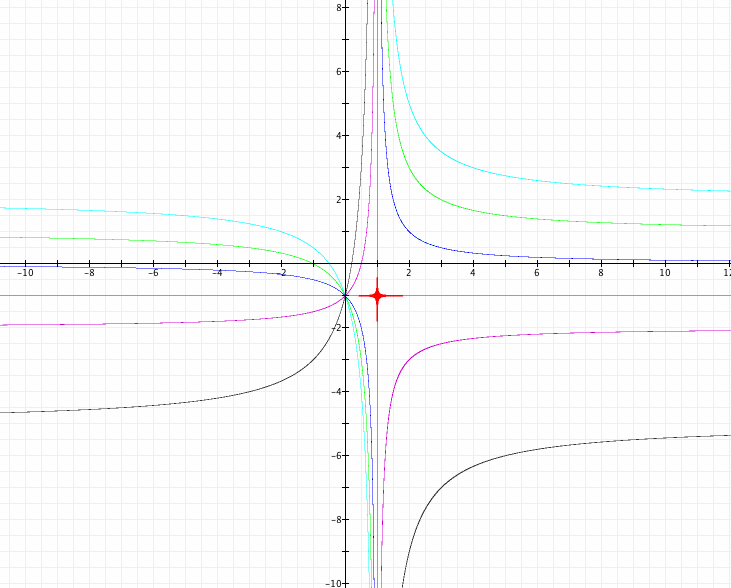
Similar to Case 1, we do have an asymptote for x=1, but y=1 is not the only asymptote.
The lime green graph is similar to our first case therefore it has similar asymptotes.
However, take a look at the cases when a=-2, 0, 2, -5.
These graphs all contain the asymptote x=1, but when a=-2, 0, 2, & -5 they also have the asymptote
y=-2, 0, 2, -5.
Could the value of a correspond to graph having an asymptote of y-a=0?
3) Now let's take a look at the graph of the equation when a and c are fixed and b is varied
Similarly to the above cases, when one of the coefficients in front of x or y are fixed, most all of the graphs have one of the same asymptotes.
Since a is fixed, most of the graphs contain the asymptote y-a=0, which in this case is y-1=0 or y=1.
In this case, b is being varied. Take a look at when b=-2, 0, 2, -5.
For these values of b, the graphs have an asymptote of x=-2, 0, 2, -5 respectively.
Therefore when b is varied the asymptote for the graph in most cases will be x-b=0.
So to sum up, the graph of xy=ax+by+c, may have asymptotes of:
x-b=0 and y-a=0.
However, we did see cases where depending on the value of c, the graph did not contain those asymptotes.
Let's take a further look into these asymptotes when b=-5 and a=2
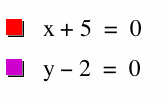
and what the graph of (x-b)(y-b) is set equal to a constant looks like
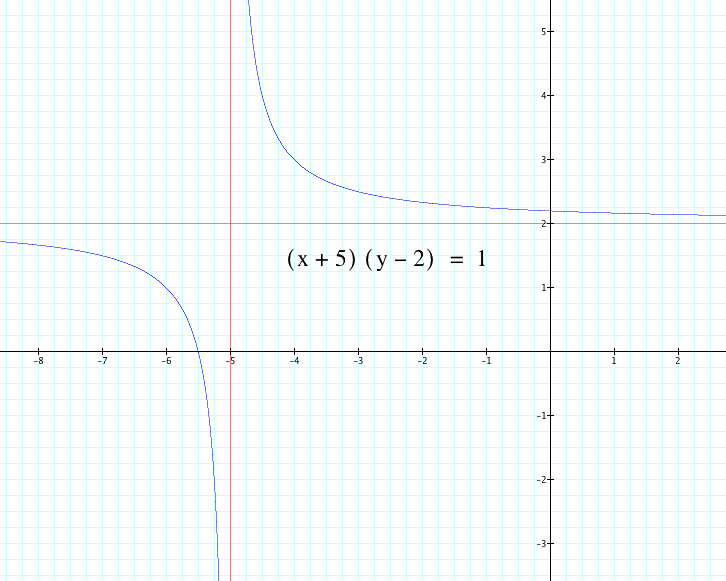
Here in this graph, we can see that also the asymptotes for (x+5)(y-2)=1 are x+5=0 and y-2=0
which is in the format of x-b=0 and y-a=0.
The graph also resembles the graphs of the various equations we graphed before.
What happens when we expand the equation (x+5)(y-2)=1?
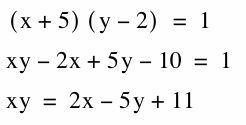
When we expand the equation and rearrange it so that xy is on the left-hand side, we have come to our original equation.
Compare the two graphs:
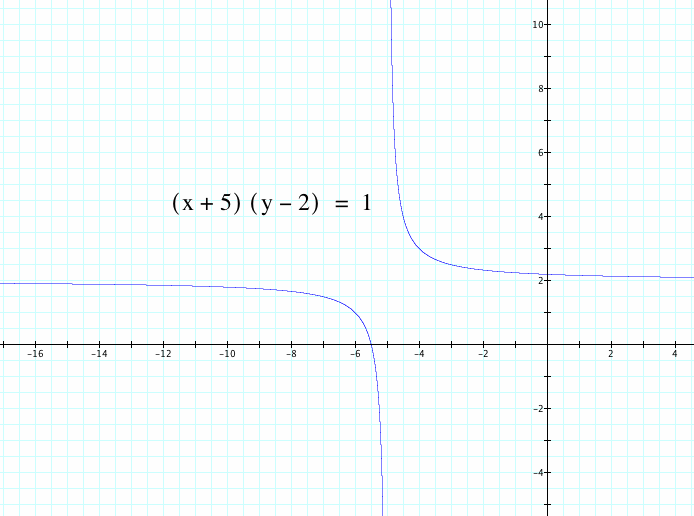
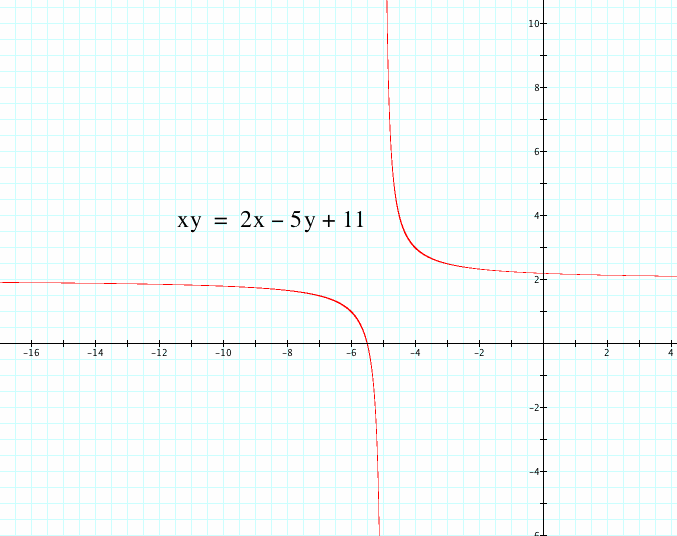
These two equations have identical graphs!
So when expanding (x-b)(y-a)=d, such that d is a constant, you have:
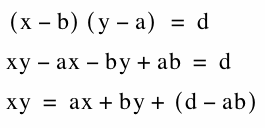
where (d-ab)=c
Return to Mary Wisniewsky's Final Page